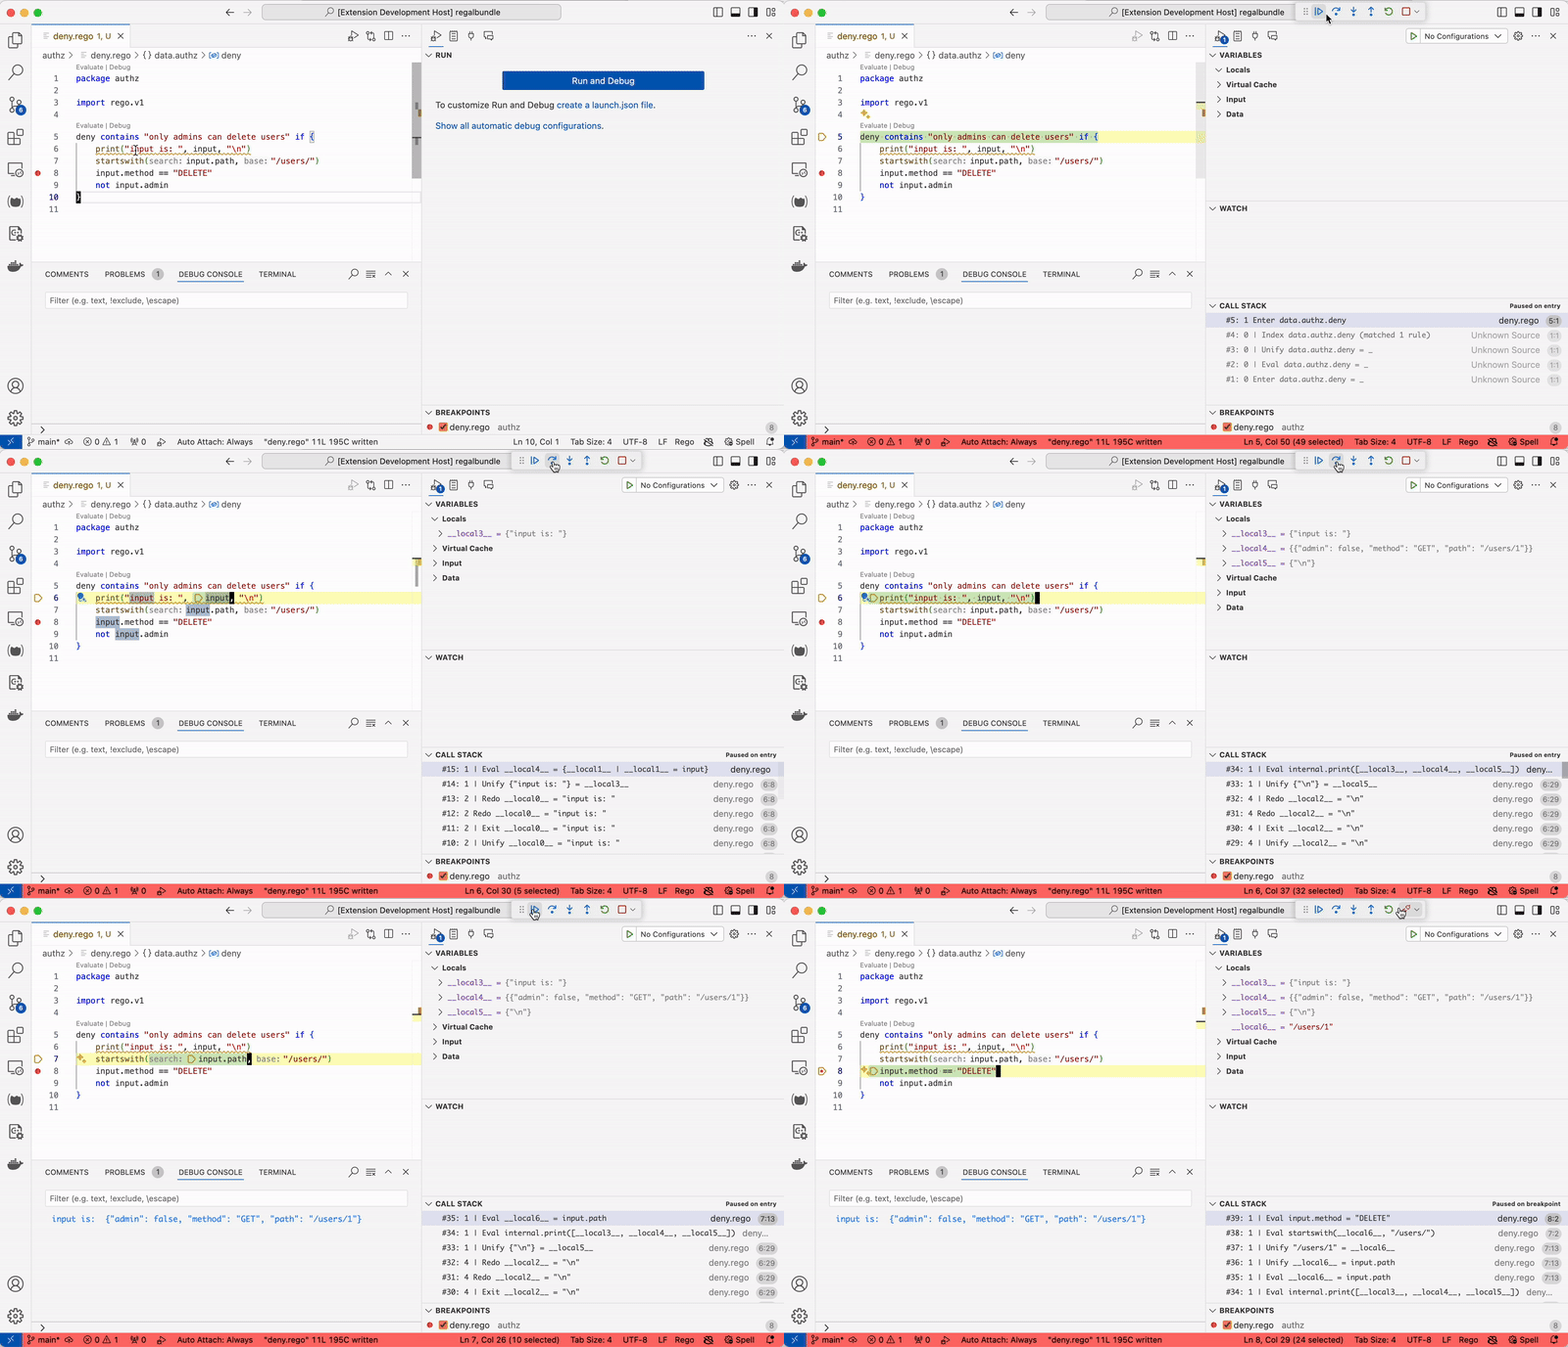
This section outlines the various tools and techniques that can be used to debug OPA, both as a component in a distributed system and as a policy engine evaluating the Rego language.
Debugging Rego Policies
Debugging Rego is crucial to ensuring OPA functions properly, as its policy engine evaluates policies written in Rego. Effective Rego debugging helps identify and resolve issues that impact OPA’s performance and behavior. A strong grasp of Rego debugging is key to ensuring the correct functioning of OPA as a whole.
Live Debugging
Using the Debug Adapter based on OPA’s Debug API, supported clients are now able to live debug Rego line by line. Breakpoints, variable inspection and print statements are all supported.
Read more about the supported editors of this debugging method in the Regal Editor Support Page.

OPA REPL and Playground
Often it can take a few tries to get a Rego policy correct, the OPA REPL and Playground are great tools for reducing the feedback loop when debugging policies.
The REPL can be run locally and loaded with the policy and data files you are working on:
opa run [policy-files] [data-files]
The Rego Playground is a web-based Rego development environment that can be used to test policies with different inputs and data. If you are interested in asking for help in the OPA Slack, the playground is a great way to share your policy and data with others.
Using the print Built-in Function
The print built-in function can be used to print values to stdout, this can be useful for checking values
during policy evaluation as well as seeing how many times a particular line of code is executed.
See the print function documentation for more details on how to use
the print built-in function in different contexts.
Performance Profiling
Sometimes the issue isn’t the correctness of the policy but rather the performance. The Policy Performance section of the documentation outlines various techniques for profiling and optimizing Rego policies.
Ecosystem Projects
Below are ecosystem projects related to Debugging Rego. Integrations are ordered by the amount of linked content.

Regal
The Linter of Rego Language by Styra
Regal can be used to debug Rego policies by identifying common mistakes. See Bugs for some example issues it can identify automatically.
Regal also implements a language server and debug adapter for Rego to allow clients to debug Rego code as users type.

VS Code Extension
OPA Integration for the VS Code editor by Styra

OPA Errors
OPA error message reference by Styra

OPA Playground
Online Rego Playground by Styra

rego-test-assertions
Helper functions for unit testing Rego by Anders Eknert
View these projects in the OPA Ecosystem.
Debugging OPA Instances in Distributed Systems
Debugging problems in distributed systems poses a number of challenges. Since OPA is commonly deployed in a distributed fashion, as part of a larger platform, it is helpful to understand the various tools and techniques available for debugging OPA in these environments.
OPA Logs
OPA logs are a great place to start when debugging issues. The logs can be used to understand what OPA is doing at any given time. Common issues such as failing to load in policy or data bundles will be shown here.
You can also enable debug logging to get more detailed information about what OPA is doing with --log-level debug.
This is documented in the CLI documentation for opa run.
Decision Logging
When OPA responds to a query, it is making a decision based on the policy and data that it has loaded. With the default logging configuration, these are not logged in detail to the OPA logs. However, it is possible to enable console decision logging by setting the following in OPA’s config file:
decision_logs:
  console: true
It might be preferable to send these logs to an HTTP endpoint or other system, to learn more about decision logging, take a look at the Decision Logging documentation.
Metrics, Health and Status APIs
Like other cloud-native tools, OPA exposes /metrics and /health endpoints that can be used to understand the
state of an OPA instance at any given time.
/metrics- exposes Prometheus metrics about the OPA instance’s memory use, bundle loading and HTTP requests. Read more in the Metrics documentation./health- shows information about the instance’s readiness to serve requests, there are options available to also show information about the loading of bundles and other plugins. Read more about the endpoint in the Health API documentation./status- is a JSON formatted endpoint that shows both health and metrics information. Read more in Status API documentation.
Manually Querying OPA
In distributed systems, it’s common that an OPA instance is being invoked by another service, sometimes it can be helpful to isolate the OPA instance and query it directly. This can be done using the REST API.
For example, to get a snapshot of the data that OPA has loaded, you can use the following command:
curl --silent https://$OPA_HOSTNAME/v1/data
Or to manually evaluate a policy rule with some input:
curl -X POST https://$OPA_HOSTNAME/v0/data/example_package/example_rule -d '{"foo": "bar"}'
Load a Production Bundle Locally
Sometimes there are too many moving parts in a distributed system to debug an issue effectively on a live system. In these cases, it can be helpful to load a bundle into a local OPA instance and debug the issue there.
You can quickly start an OPA instance with a remote bundle using the following command:
opa run -s https://example.com/bundles/bundle.tar.gz
If you need to configure the OPA instance with other options, you can use a config file to make more detailed configurations. Read more in the Configuration documentation documentation.
Feedback
Was this page helpful?
Glad to hear it! Please tell us how we can improve.
Sorry to hear that. Please tell us how we can improve.
